上川純
一
|
|
Debian で FFT を取り扱う C のアプリケーションを書いてみたいと思うことはありませんか?今日は音声データを分析してみ ましょう。
wav ファイルを入力として受け取り、 FFT を実行してその結果を表示するアプリケーションを作成してみ ます。
libfftw3 をインストールします。 あと、 音声ファイルをロードするために sndfile1 を利用します。
$ apt-get install libfftw3-dev libsndfile1-dev
|
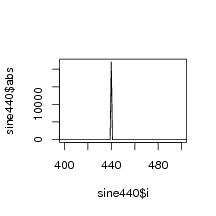
まず、 テスト用に FFT の結果が予想できるデータを作成してみます。 ここでは 440Hz のきれいなサイン波を作成してい ます。
 |
/*BINFMTC: -lsndfile -lm
Create a sine wave at 44.1kHz for 1 second called sine.wav */ #include <stdlib.h> #include <stdio.h> #include <sndfile.h> #include <math.h> int create_sine(const char* filename, int size, double frequency) { SF_INFO sfinfo = { .frames = size, .samplerate = 44100, .channels = 1, .format = SF_FORMAT_WAV | SF_FORMAT_PCM_16, .sections = 0, .seekable = 0 }; SNDFILE* s = sf_open(filename, SFM_WRITE, &sfinfo); double* data = malloc(sizeof(double) * size); int i; for (i=0; i < size; ++i) { data[i] = sin(frequency * 2.0 * M_PI * i / 44100.0); } sf_writef_double(s, data, size); sf_close(s); return 0; } int main() { return create_sine("sine.wav", 44100, 440.0); } |
テスト用の入力値として、 適当な wav ファイルを用意しましょう。
今回は手元で、 aeolus というオルガンシミュレータを起動し、 jack で接続させ、 ecasound を jack 入力に対して待機させ、 qjackctl で接続させて収録しました。
それなりに長い時間録音したデータから 16-bit mono の PCM データ 1 秒分を切り出して実験用データを作成しま した。
$ qjackctl &
$ aeolus & $ vkeybd & $ ecasound -i jack -o test.wav ctrl-C で中断 $ sweep test.wav # 適当に編集 $ file ra-mono.wav # 切り出した結果を確認 ra-mono.wav: RIFF (little-endian) data, WAVE audio, Microsoft PCM, 16 bit, mono 44100 Hz |
sndfile と fftw3 を使ってフーリエ変換して出力をダンプしてみましょう。 サンプルコードは sndfile を使い double の配列に wav ファイルの中身を展開して、 その内容を fftw に渡して処理しています。 double の値は各 1/44100 秒の瞬間における空気 の圧力を表しているようです。
/*BINFMTC: -lsndfile -lfftw3 -lm
*/ #include <stdlib.h> #include <stdio.h> #include <sndfile.h> #include <math.h> #include <complex.h> #include <fftw3.h> /* process with FFTW */ void study_sound(double* data, int size) { fftw_complex* spectrum; fftw_plan p; int i; spectrum = (fftw_complex*) fftw_malloc(sizeof(fftw_complex) * (size / 2 + 1)); p = fftw_plan_dft_r2c_1d(size, data, spectrum, FFTW_ESTIMATE); /* process with FFTW */ fftw_execute(p); /* dump output in CSV format */ printf("i,abs,arg\n"); for (i=0; i<(size/2+1); ++i) { printf("%i,%f,%f\n", i, cabs(spectrum[i]), carg(spectrum[i]) / 2.0 / M_PI * 360.0); } fftw_destroy_plan(p); fftw_free(spectrum); } /* Process wav file. @return 1 on failure, 0 on success. */ int process_wav_file(const char* filename, int size) { SF_INFO sfinfo = {0, 0, 0, 0, 0, 0}; SNDFILE* s = sf_open(filename, SFM_READ, &sfinfo); double* data = malloc(sizeof(double) * size); if (!s || !data) { fprintf(stderr, "Something went wrong opening the file or allocating memory\n"); return 1; } if (sfinfo.channels != 1) { fprintf(stderr, "Please give me monaural audio data\n"); return 1; } /* Read wav file into an array of double */ sf_readf_double(s, data, size / sfinfo.channels); study_sound(data, size / sfinfo.channels); sf_close(s); return 0; } int main(int argc, char** argv) { process_wav_file(argv[1], atoi(argv[2])); return 0; } |
実行してみます。
$ ./sndfile-fftw.c sine.wav 44100 > sine.csv
$ ./sndfile-fftw.c ra-1sec.wav 44100 > ra.csv |
CSV ファイル形式でデータが出力されました。 簡単にグラフを作成するためのツールとしてここでは R を使ってみ ます。
$ R
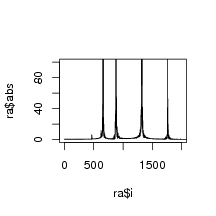
> sine <- read.csv("sine.csv") > ra <- read.csv("ra.csv") > postscript("sine.eps", horizontal=FALSE, height=3, width=3) > plot(sine$i, sine$abs, xlim=c(400,500), ylim=c(0,22000), type="l") > dev.off() > postscript("ra.eps", horizontal=FALSE, height=3, width=3) > plot(ra$i, ra$abs, xlim=c(0,2000), ylim=c(0,100), type="l") > dev.off() |
図 7.6の 440Hz のサイン波を処理した結果を見てみると、 440 Hz あたりにグラフの突起があるのが見て取れ ます。
しかし、 実際にオルガン音を処理した結果の図 7.6を見てみると、 グラフに突起が多数あって、 結構複雑です。 そのまま簡単 に処理させてくれはしなさそうです。
第
62 回東京エリア Debian 勉強会 2010 年 3 月
____________________________________________________________________________________________